Trends

We update a lot of numbers each year. Which means that, from time to time, we sometimes forget to update any one of them when we get excited about another bit of data or insight. Someone recently pointed out we missed refreshing the social posting frequency stats for 2016 after they started to drop in 2015. Did that fall continue? Take a look.
The Goods
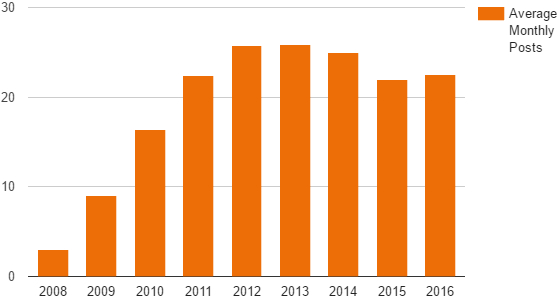
To find our answer we looked at 1,100 resort and hotel Facebook accounts. We found the average monthly posting frequency for every year since 2008. Here’s how it looks.
In 2015 we saw a steep drop relative to the year before, but 2016 saw that stat quickly level off. More specifically, the resorts in our sample posted 22.0 times per month on average during 2015 and 22.5 times per month on average during 2016.
What This Means
Again, we saw the exact same trend on other channels as well. Twitter posting volume dropped 19.8% from 2014 to 2015, but fell just 1.2% in 2016. YouTube dropped 15% from 2014 to 2015, but fell less than 5% in 2016.
So is it leveling out for good? Perhaps. Initial results for the first few months of 2017 show a slight drop again but we’ll be back in January to see how this trend plays out.
Next Week, More
We’ve been publishing resort-specific marketing insights like this one (almost) every week since 2012. Don’t want to miss the next round? Stick your email below.