Destinations
The reason BI efforts fail isn’t because the numbers were bad it’s because the numbers weren’t enough. We take a different approach. From day 1, every DestiMetrics user has not only had access to powerful data, but a team of experts that helps them identify, understand, and apply the lessons locked therein. A team that’s filled with people like Katie Barnes.
—
Gregg: Katie, let’s back up a few years. How did you end up with Inntopia?
Katie: I came to Inntopia when DestiMetrics was acquired in December of 2016. I had been working at the Chamber & Tourism Bureau in Vail, Colorado where I ran the Cen Res, among other things. During my tenure there I was involved with what’s now the Resort Reservations Association (formerly CRADR) where I was introduced to DestiMetrics and Inntopia. Since 2008 I’ve dabbled in almost every part of the company, from sales and marketing to account management, communications, and analysis.
Gregg: You guys get a lot done, so I’d imagine “every part of the company” isn’t a short list. What does your day typically look like?
Katie: A typical day for me may entail:
My main objective is to make sure our clients’ needs are met and that they are understanding, applying and sharing the insight gained from their DestiMetrics reports.
Gregg: Oh, is that all? Talk a little bit more about that goal to help subscribers understand and apply this insight. For example, the quarterly webinars; how do those work?
Katie: Each quarter we hold Market Update webinars for our DestiMetrics Subscribers who have bought in to what we call our Market Intelligence Pack. These webinars are an hour long and cover national economic indicators that may affect travel and consumer spending as well as key news stories and trends that are pertinent to the the travel industry
We then review our industry-wide lodging performance (an aggregate of all properties in our destinations) for the current season and preview the upcoming season.
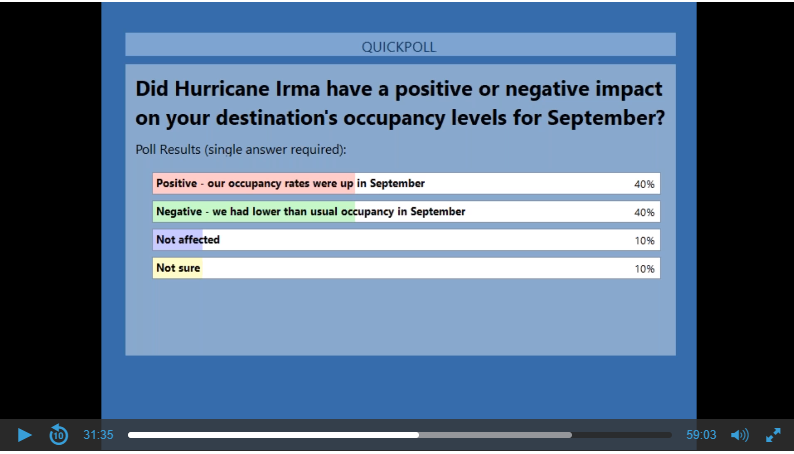
A key part of each webinar is polling the audience on trends and outside forces that impact demand.
Gregg: These started in ski, but you also do this for the Southeast region as well?
Katie: Correct. We hold two different webinars each quarter – one for the West (mountains) and one for the Southeast (sun and beach). I focus on the webinar for the West while my colleague Jane Babilon handles the Southeast.
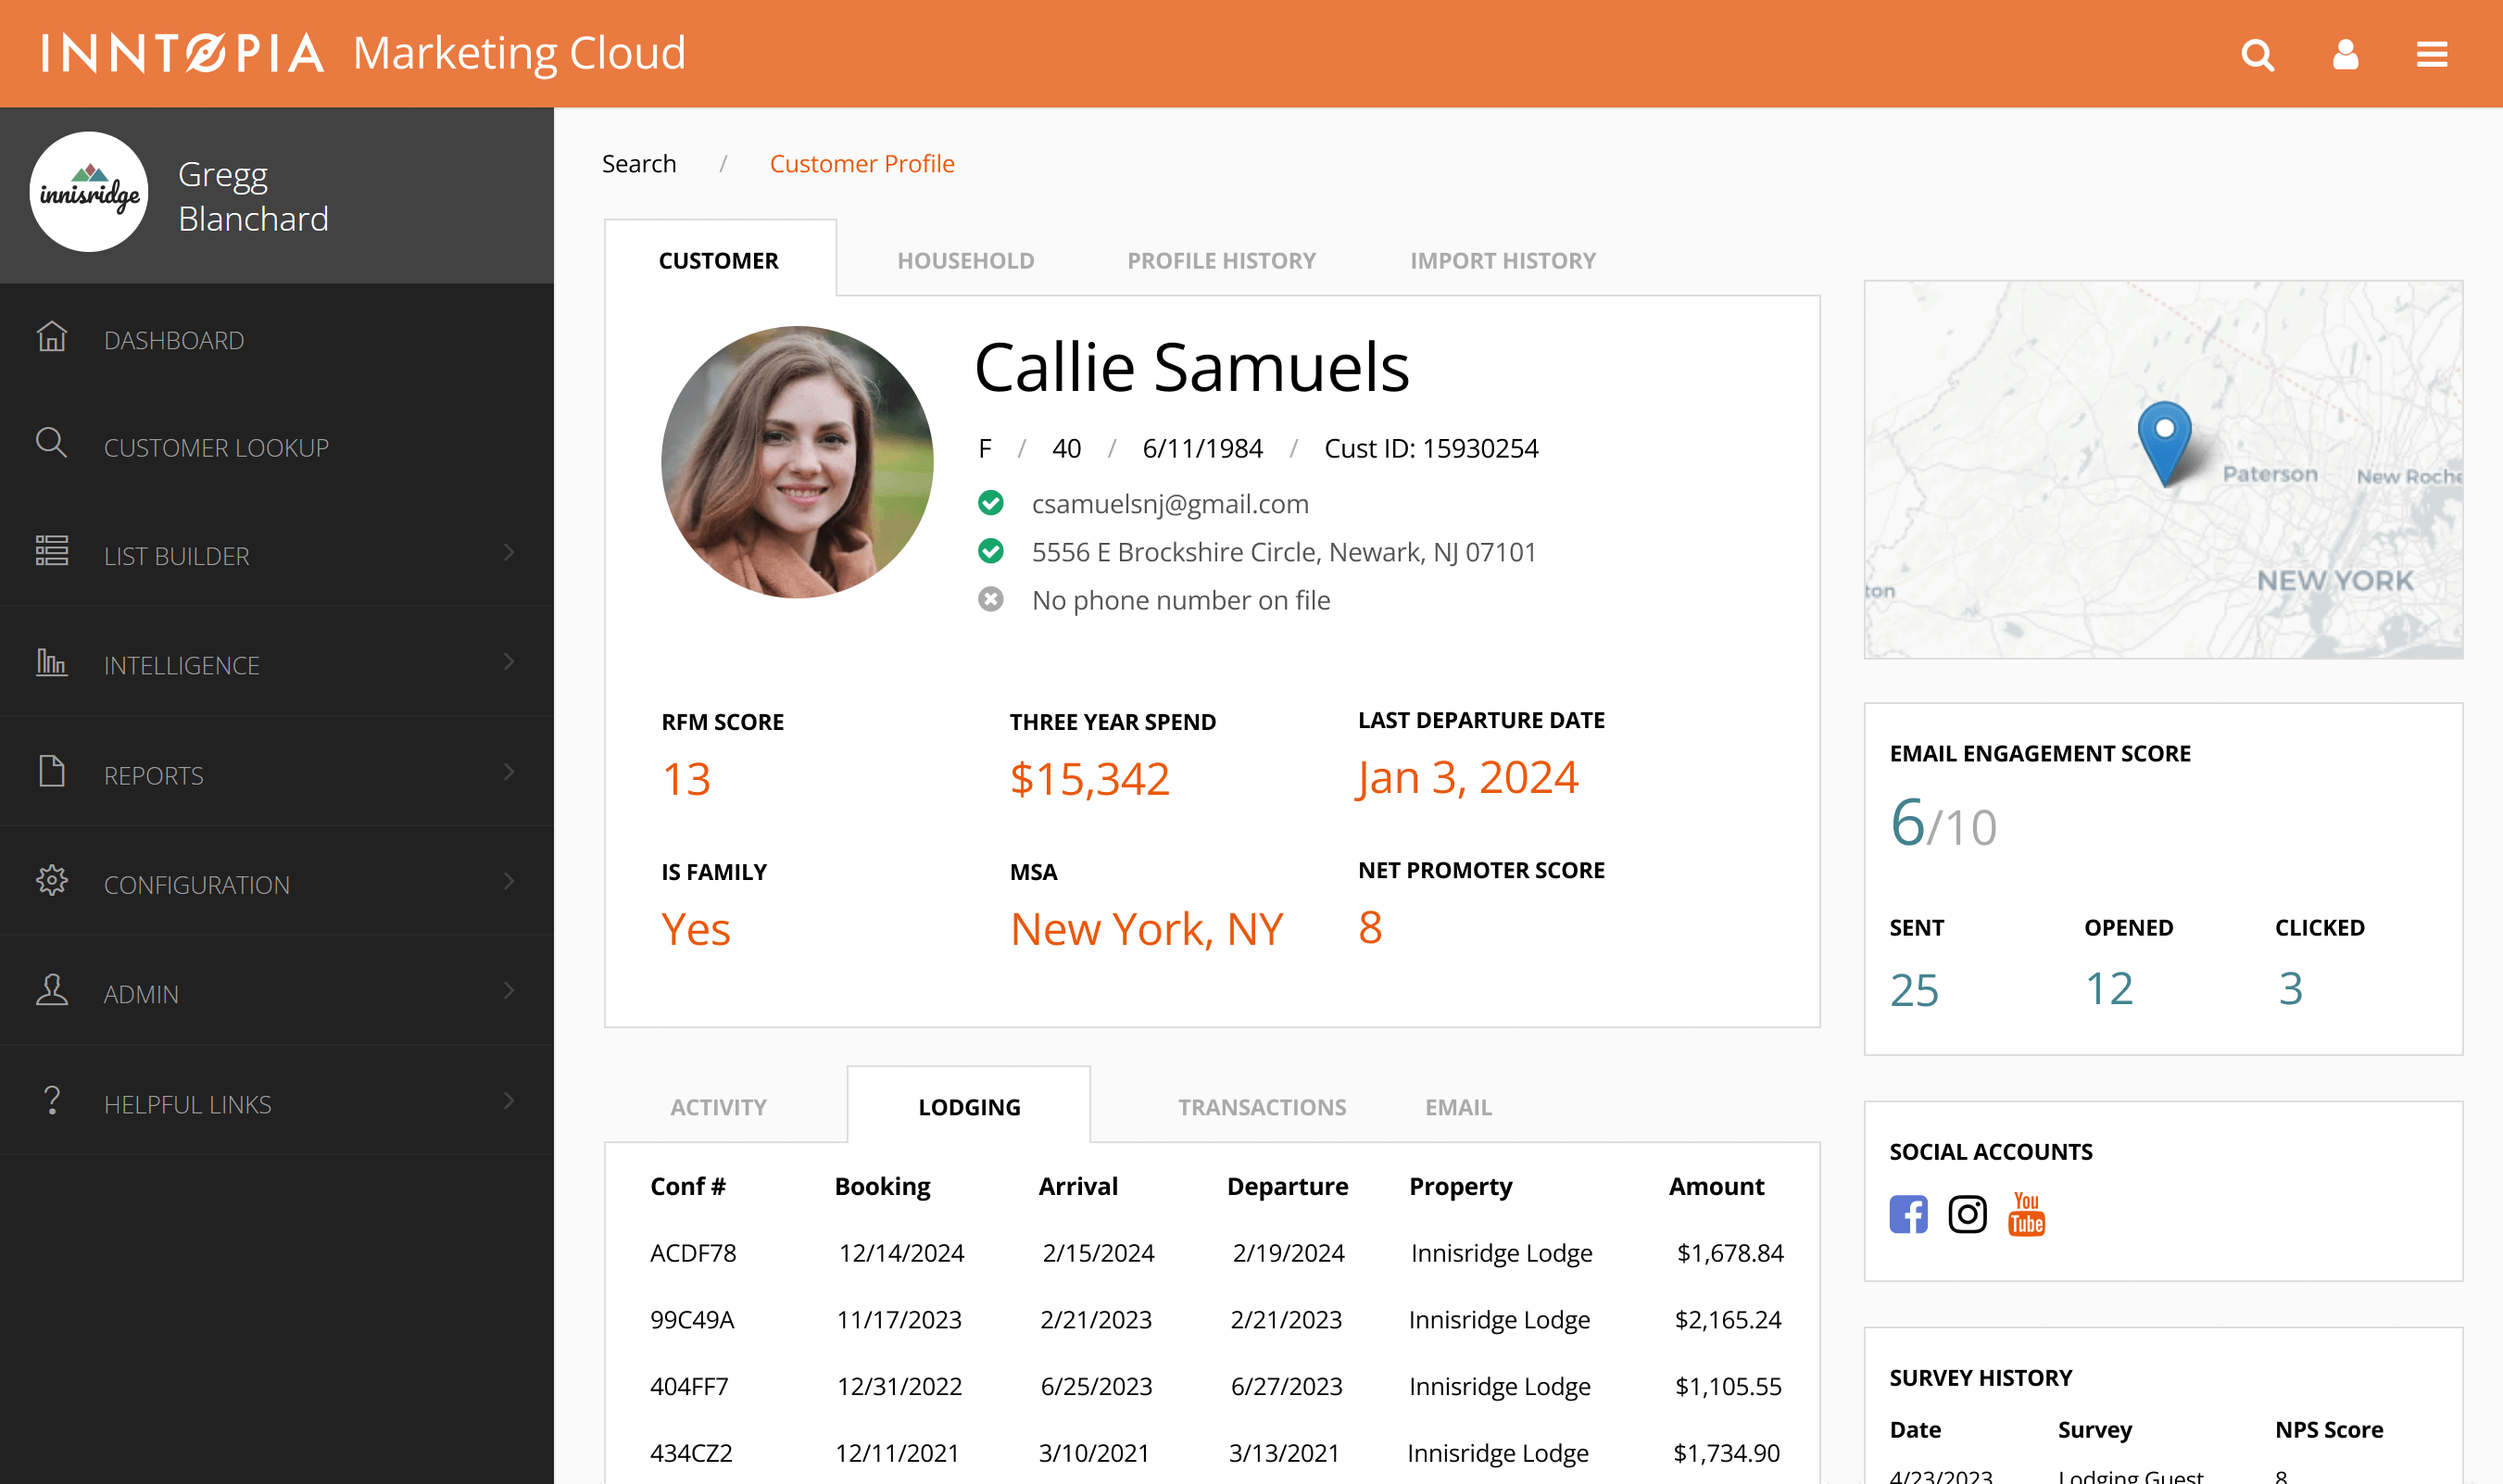
Gregg: And what data points are you reporting on?
Katie: We show how the industry is performing in occupancy, average daily rate and RevPAR among other things. Since we collect data based on reservations on the books, we can present forward-looking data as well.
For example, our next webinar will be held in mid-March, where we’ll be presenting data as of February 31st. We’ll have historic actuals from December 2017 through February 2018 and “on the books” data from March 2018 through August 2018.
Gregg: At the end of the day, what’s the goal of these webinars?
Katie: We have a much broader point of view on the industry than our clients so we can talk about booking trends we are seeing across all of our destinations and dive deeper than our clients can. These webinars ensure that our clients are understanding the data and are taking the time to digest it. Our reports are useless if they aren’t understood and applied so making sure our clients are indeed doing this is critical.
Gregg: Let’s dig into that last sentence quickly. It’s easy to think “oh, I can read charts, I’m good” but what kind of feedback do you get from DestiMetrics subscribers?
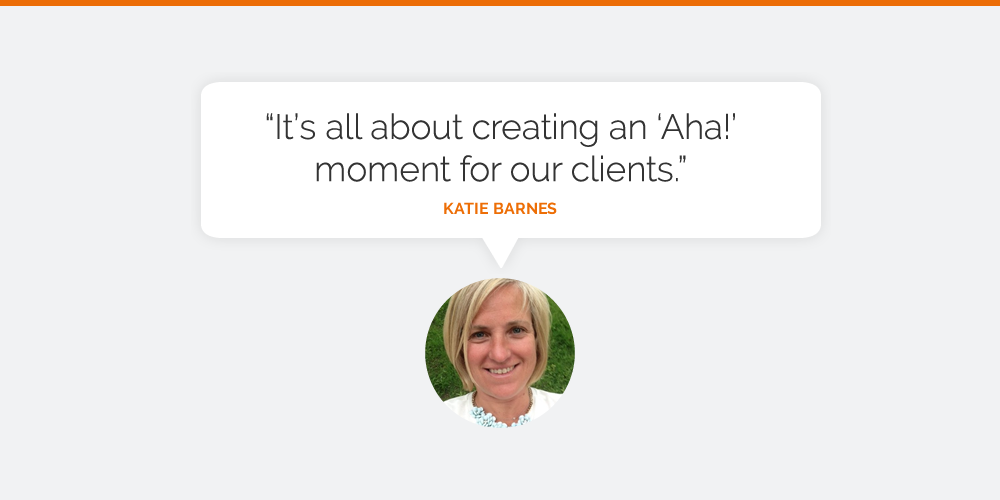
Katie: It’s all about creating an “Aha!” moment for our clients. We can help them read the charts and graphs, but the data are most powerful when they understand both the cause and the effect. We challenge them to go deeper, find out the “why” behind their data and encourage them to have a more well round view of their performance.
For example, while having a monthly meeting with a destination client to review their reports, we noticed that they were not seeing a rise in occupancy over the MLK weekend like the rest of the industry. We brought that to their attention and they researched school breaks in some of their key markets and found that many school districts are no longer letting kids out for that holiday (the primary driver of demand). Now, when helping their community plan for the influx of visitors to their destination or planning their marketing and promotions, they can be smarter about MLK weekend.
School break reports help properties and destinations identify the impacts and YOY changes of school breaks across the country.
Gregg: Love that. Most of this data and insight – the webinars included – is all subscriber only, correct?
Katie: Yes, but we do occasionally let people in to webinars for a sneak peek. As I mentioned earlier, our next webinar is next week so if anyone reading this would be interested, let me know. I can’t guarantee access, but send me an email (kbarnes@inntopia.com) and we’ll see if it’s doable.
Our newsletters that cover travel news and trends, on the other hand, are available to the public at no cost (click here to sign up).
Gregg: Good stuff. Thanks so much for the time, Katie!
Katie: No problem!