 Gregg Blanchard
Once novel, social icons in the header or footer (or both) of an email template are now nearly ubiquitous. But how many people actually click them? It’s a simple question but one that could act as a useful insight for future design decisions. Here’s what we found.
The Goods
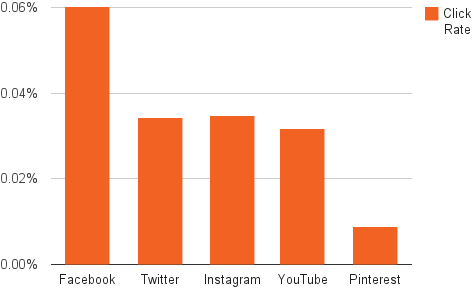
To find our answer we looked at 50 large email campaigns sent by 10 U.S. resorts. Combined, these campaigns were opened by about 650,000 recipients. We found the average click rate (clicks/opens) for each social icon link in these campaigns and plotted the average below.

Facebook saw the highest click rate of about 0.06% with Twitter, Instagram, and YouTube all sitting around 0.03%. Pinterest saw the lowest click rate of about 0.01%.
What This Means
Let’s put those numbers a different way by looking at an average icon like Twitter. If you send 1,000,000 emails a year, a 20% open rate will earn you about 200,000 opens. At a 0.03% click rate that comes out to 60 clicks per year.
This might be expected, especially for something that isn’t the focus of the message, but when you consider that along the way over 15x as many people will click the unsubscribe link in those same emails, it does help put the performance of these icons into context.
Have a question? Just ask.

Tyler Maynard
SVP of Business Development
Ski / Golf / Destination Research
Schedule a Call with Tyler→

Doug Kellogg
Director of Business Development
Hospitality / Attractions
Schedule a Call with Doug→
If you're a current Inntopia customer, contact support directly for the quickest response →
Request Demo
A member of our team will get back to you ASAP to schedule a convenient time.


