
 Jane Babilon
Favorite Things is a series of posts by Inntopia employees about their favorite parts of the systems and services we offer. Some are big, some are small, some are simple, and some are complex. Enjoy a veritable cornucopia of hidden gems by visiting the Favorite Things archives.
A frequent question from our destination clients (a.k.a. DMOs) is how to add value for their participating properties in order to incentivise their participation. Because without the data from those participating properties, the program can’t function. So they want to understand how to make that participation seem attractive.
In other words, when it comes to DestiMetrics, the value to the DMO is obvious, but hotels, resorts, and property managers want to know what’s in it for them. Fair enough! And luckily there is a great answer that not everyone knows about: the Prop Comp report.
The Power of Prop Comps
While there are several variations of Prop Comp reports, there are 3 primary ones that allow properties to compare their own performance either with that of their full destination or with a specific comp set of their choice. This allows them to dig deeper into the data and really get a handle on how they are doing in relation to their competitors and peers. These 3 reports are:
- The Property vs Destination report
- A Standard Prop Comp report
- A Multi-Property Comp report
The Property vs. Destination report is free for all participating properties. The other two are add-ons that resorts, hotels, and property managers can purchase for a small annual fee). And they’re especially powerful because they allow a property to choose the comp set against which they are compared.

Together, they provide three key benefits.
#1 Gain a better understanding of how the market is faring, and your part in that.
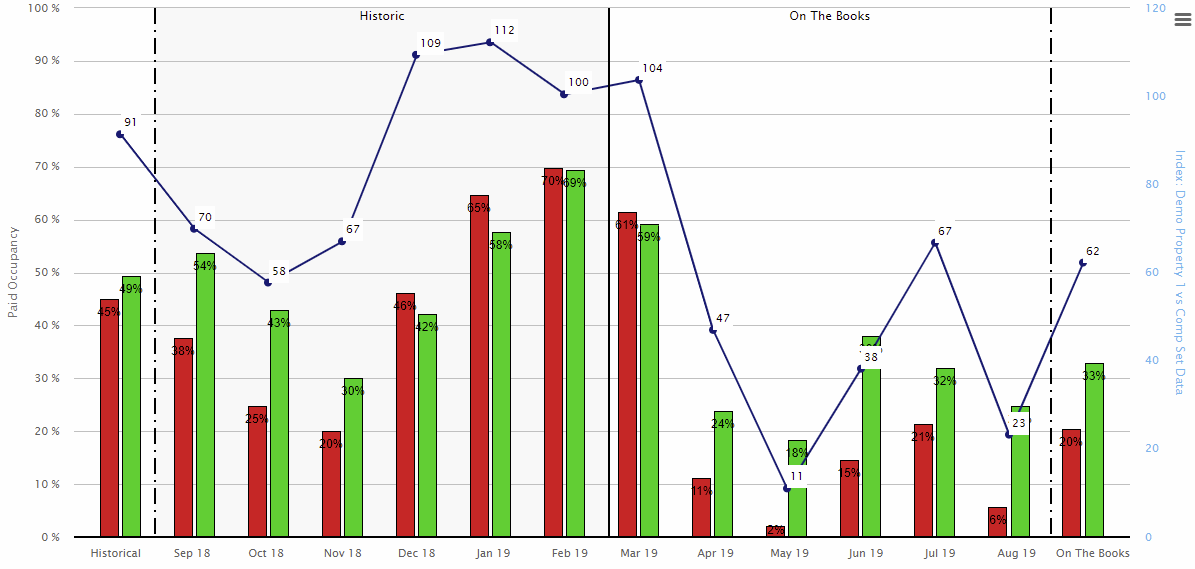
As a participant in a destination lodging research program you get access to all the destination and regional reports that allow you to see how the geographic areas which you’re a part of are faring, but Prop Comp reports allow you to dig deeper and see your specific property’s KPIs compared against the destination’s.
#2 Have data that allows you to take action when your performance is lagging behind that of your competitors.
Our standard reports provide you not only with historic data about the destination, but also with 6 months of forward-looking data based on the reservations on the books. The property level reports provide that same forward-looking view so you can understand how you’re performing in relation to your competition while there is time to do something about it. In other words, they allow you to adjust your marketing plan to fit what’s going on in your market.
#3 Leverage your program participation for maximum benefit
The Property vs. Destination report is complementary for program participants, while the other 2 are provided for a minimal annual fee. Your destination is funding the overall program, so take advantage of that! You’ve got access to a full data set about your property you can use to make better planning and marketing decisions.
Everyone Wins
If your DMO has a DestiMetrics program, they’re confident it will provide value not just to the DMO but also to all of its constituents. You can help your destination understand its lodging data better by participating and submitting anonymized data, but you can also get a free leg up on your competition, look at your property specific views, and use the data to make informed decisions about the market and your position in it.
How do you access these magical Prop Comp reports? Just log into your dashboard to see the Property vs. Destination report, and get in touch if you’re interested in seeing samples of the other two.
Oh, and if your DMO doesn’t have a DestiMetrics program? Let’s fix that!
Have a question? Just ask.

Tyler Maynard
SVP of Business Development
Ski / Golf / Destination Research
Schedule a Call with Tyler→

Doug Kellogg
Director of Business Development
Hospitality / Attractions
Schedule a Call with Doug→
If you're a current Inntopia customer, contact support directly for the quickest response →
Request Demo
A member of our team will get back to you ASAP to schedule a convenient time.


