News

We ended 2019 with a lot of momentum, and January saw the teams firing on all cylinders. And that’s not just marketing speak, many of our clients commented that:
“Man, you guys are really jammin’ right now!”
To which we respond: yes…yes they are. Here are a few of our greatest hits from the last handful of weeks.
User Roles
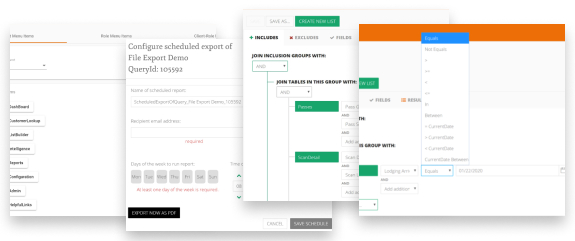
First up is a really powerful user role functionality. You can either grant a user a predefined role that comes with access to certain pages or customize each user’s access to only the areas of what they need. Customer service team only needs customer lookup? Revenue Management just needs reports? Done and done.
New Scan Detail
With the addition of additional scan detail to the database, you can now query scans by date range, scan location, and more. You can also use scan in the fields tab to customize your output with scan data.

New Custom File Export Options
With these new additions you can take virtually any output from List Builder and schedule it to be sent to any email address or 3rd party app at any cadence. Does your digital agency need a file of all upcoming arrivals for an ad buy? Yep, we can do that
Dynamic Date Ranges
And, with that enhanced export functionality, this is where our new dynamic date ranges really shine. Instead of static dates, you can build queries using dates relative to a variable like “current date” instead of “Jan 27, 2020”.
Email Campaign Dashboard
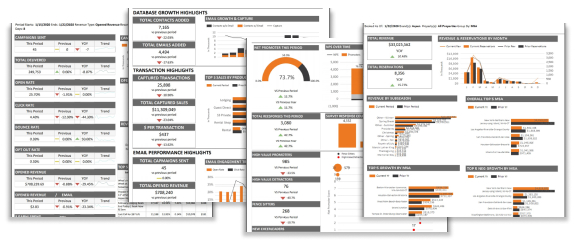
I love this new email campaign dashboard. In one screen you get a high-level view of everything email including revenue generated, email KPIs, revenue by campaign type, and more.
Executive Summary Dashboard
This dashboard is also extremely powerful. Perfect for your higher-level executives and management, it also covers email but includes transaction volumes and basic pacing data.

Lodging Pace Dashboard
Speaking of pacing data, the new Lodging Pace Dashboard really gets to the heart of these KPIs and digs into YOY lodging pacing by subseason, MSA, and more.
NPS Dashboard
Finally, this dashboard distills the key findings and trends from other NPS reporting into a succinct, actionable report that helps you monitor overall NPS scoring as well as groups of guests whose loyalty is at risk. Take your CX programs to the next level, with the included “gameboard” that details the intersection of guest value (RFM) and guest sentiment (NPS).
And I just got a sneak preview of next month’s list and…yeah…it’s pretty awesome.
See you next month!