Every month, property managers submit occupancy and rate data to DestiMetrics, which is anonymized and combined with other lodging providers in their area to create the destination-level forecasts and reports that DMOs get so much value from.
But that same data can be used to give individual lodging and revenue managers game-changing property-level charts and data.

Imagine knowing exactly how your rates, occupancy, ADR, and RevPAR compare to your past, your peers, and the rest of your destination…six months into the future.
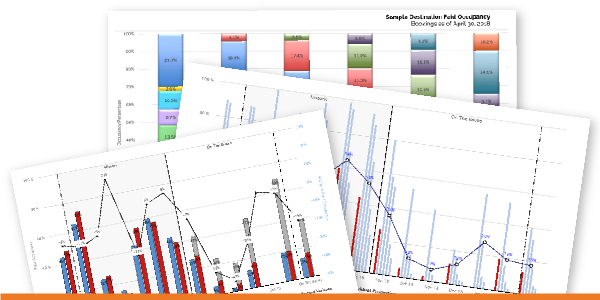
We’ve packaged our most useful property-level reports into Property Packs that combine to give lodging providers the data they need to set rates, stay competitive, and out-manage the competition.
| 3-pack | 5-pack | 7-pack | Single | |
|---|---|---|---|---|
| Multi Property Comparative (MPC) Report
Using the format of the destination-wide Multi Destination Comparative (MDC), this report compares your property’s performance to the [anonymized] performance of a comp set of your choice. Includes occupancy, ADR & RevPAR. Monthly report, monthly data. |
✓ | ✓ | ✓ | $450 |
| Benchmarking Index Report
This report indexes your occupancy, ADR and RevPAR against your 2007 (pre-recession) performance. If we do not have historic data back to 2007, we will index to oldest data available. Seasonal report, monthly data. |
✓ | ✓ | ✓ | $250 |
| Revenue Ranking Report
Seasonal Ranking of Your Property’s Year over Year Change in RevPAR against the Industry and your own destination. Seasonal report, monthly data. |
✓ | ✓ | ✓ | $300 |
| Property vs. Self Report
Presented in our standard Reservation Activity Outlook format, this report includes a comparison of your property’s year over year occupancy, ADR and RevPAR for the past 6 months and the forward-looking 6 months. Monthly report, monthly data. |
✓ | ✓ | $300 | |
| Property vs. Destination Report
Presented in the format of our Daily Occupancy Report, this report compares the daily occupancy of your property to your destination. Quarterly report, daily data. |
✓ | ✓ | $500 | |
| Daily Prop Comp Report
Daily Occupancy Report that compares the daily occupancy of your property to the aggregate performance of a comp set of your choice. Quarterly report, daily data. |
✓ | $500 | ||
| Occupancy Lead-Time Analysis
This report identifies the percentage of your occupancy that was booked during each of the prior six months. It also shows the ADR for each month’s bookings. Seasonal report, monthly data. |
✓ | $350 | ||
| Property Comparative (Prop Comp) Report
Using the format of the Reservation Activity Outlook (RAO), this report compares your property’s performance to the [aggregated] performance of a comp set of your choice. Includes occupancy, ADR & RevPAR. Monthly report, monthly data. |
✓ | $450 | ||
| 3-pack | 5-pack | 7-pack | ||
|
Report Pack Pricing
|
$925 |
$1,250 |
$2,000 |
— |


