News

We have an amazing group of resorts using our Marketing Cloud platform. What many people don’t realize, however, is just how diverse this group is. Big vs small, east vs west, US vs international, ski vs golf, lodging vs just activities, our clients cover the full range of hospitality and recreation.
Now, if you’re a data-nut like me you can probably see the opportunity. Yep, benchmarking. And not just generic benchmarking, but the useful, accurate stuff that compares your performance to brands very similar to yours.
For years, we’ve helped individual clients benchmark themselves once or twice a season. Typically, we’ll do this after we release our annual end-of-season performance reports. But today, I’m excited to announce the new Email Performance Benchmarking dashboard within Inntopia Marketing Cloud.

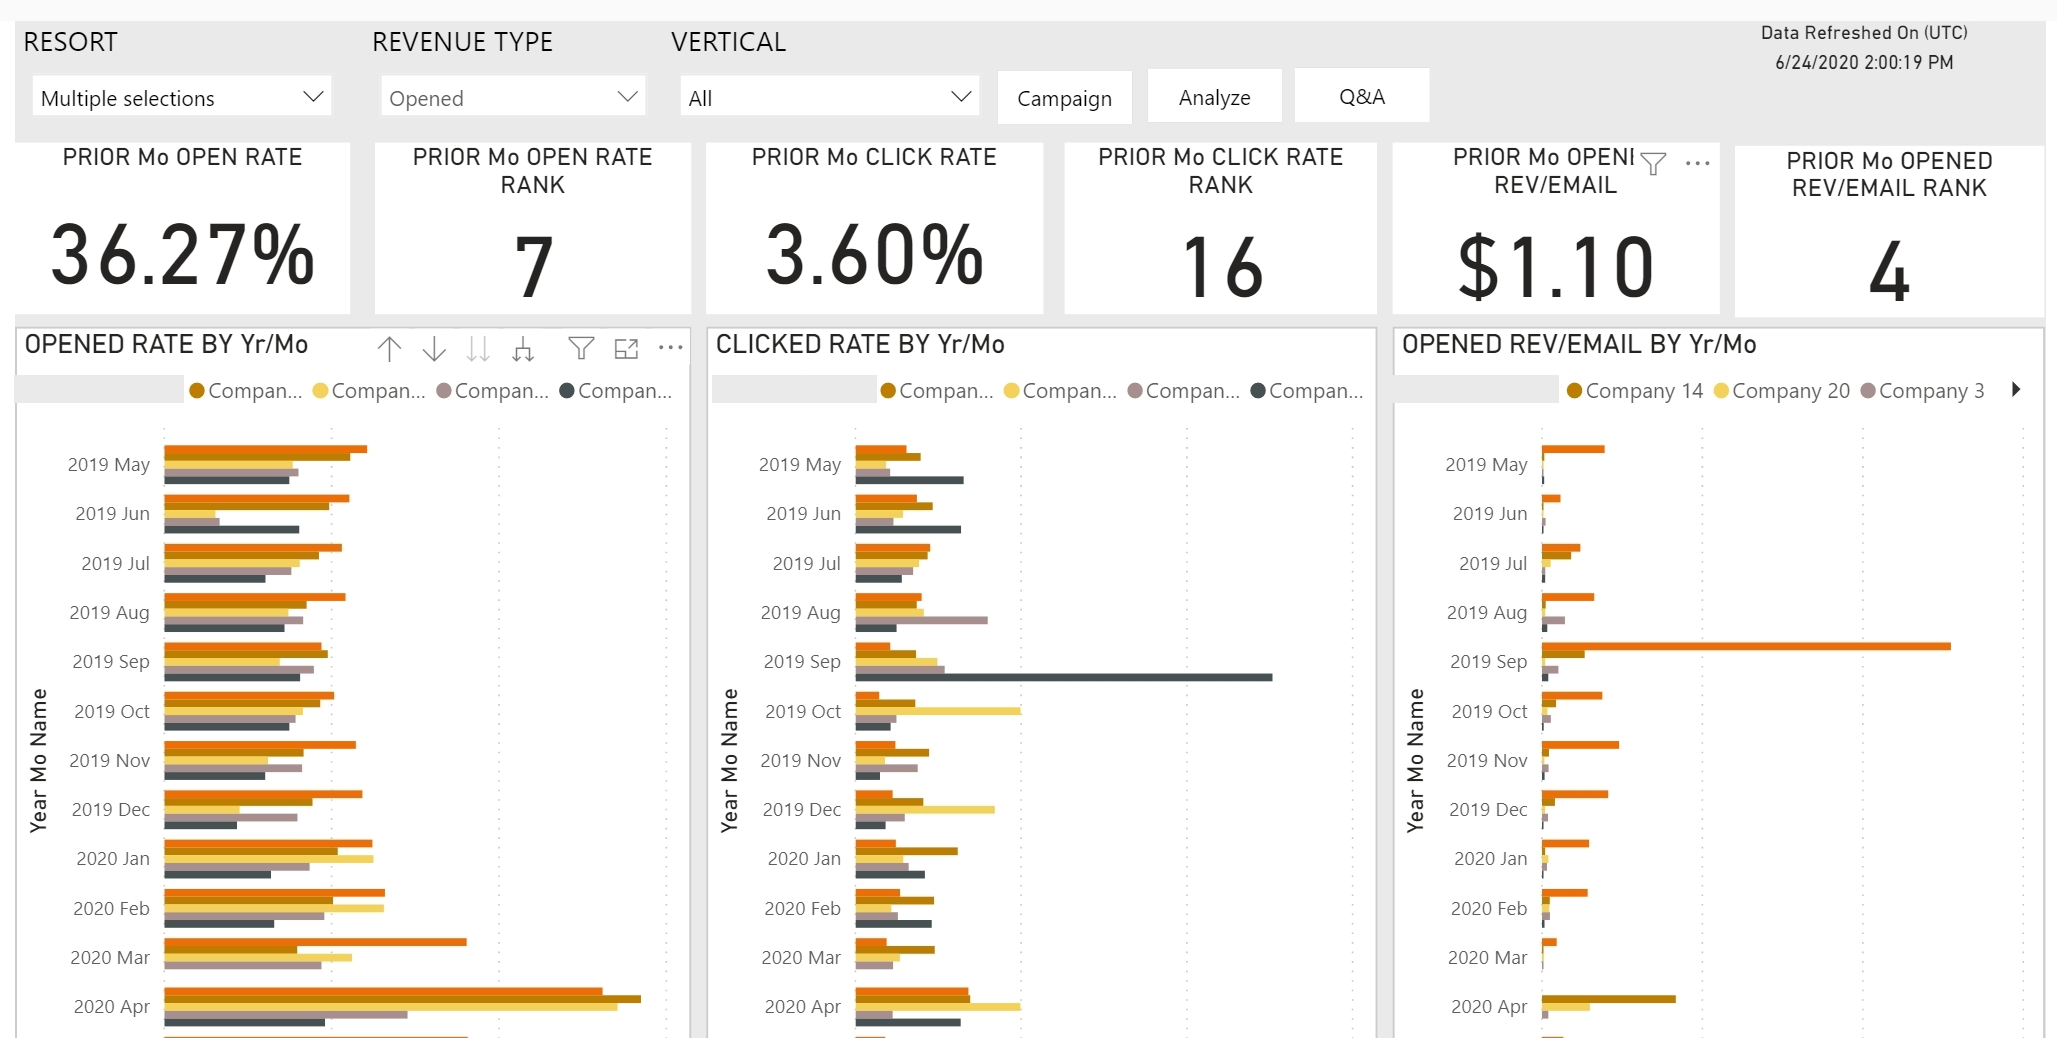
This dashboard compares your email performance to the email performance of a hand-selected peer group across a bunch of KPIs including:
Even more, you can compare not just recent performance but monthly stats for the last 12 months.
Toss in geographic comparisons by market, drilldowns into revenue by folks who open or click, and you’ve got an amazingly powerful set of data to give your performance priceless context.
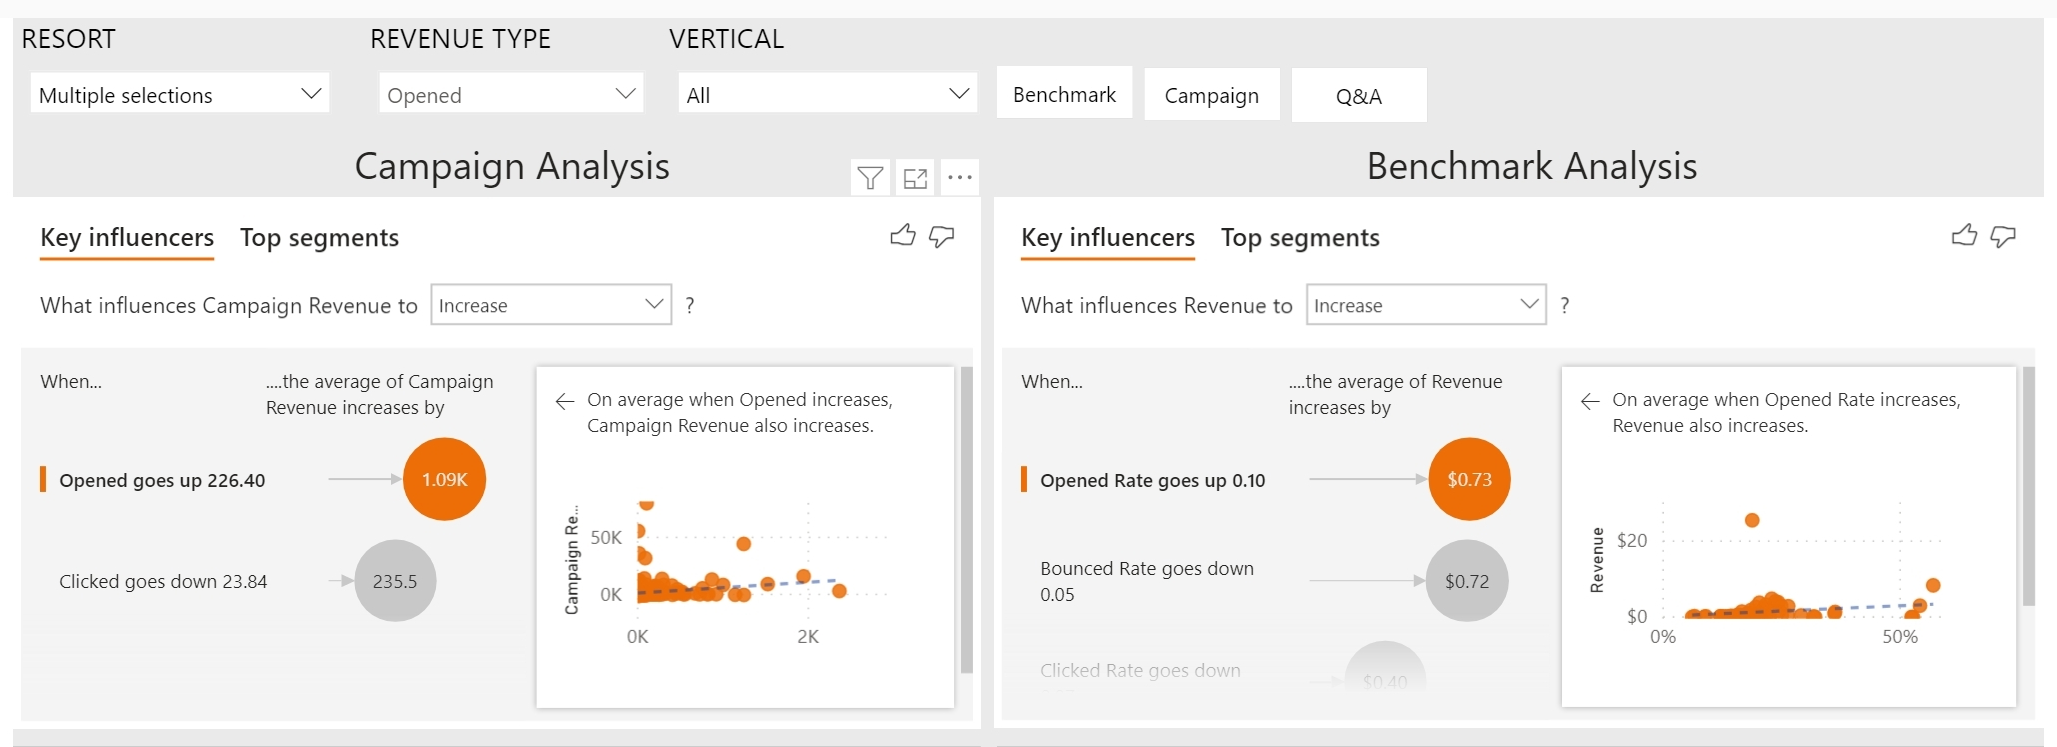
The thing that got me most excited when I saw the demo of this dashboard, however, was the technology it’s built it. Because it’s running on Microsoft Power BI; a platform that can actually tease out the insights you’re looking for without you, well, having to look for them.


Type a question about your performance into the prompt and it’ll show you the answer.
“What time of day do my campaigns get the highest open rate relative to my competitors?”
It’s completely magical.
Want a closer look? Talk to your account manager or contact us.