Trends
We publish a lot of email data. We talk about a lot of email data. When we talk about the data we’ve published, one question often comes up: Why do we wait until the end of one month to publish benchmarks for the previous month? The simple answer is that email has a really long tail when it comes to opens. But how long? And how does that compare to social? That’s what we’re taking a look at today.
The Goods
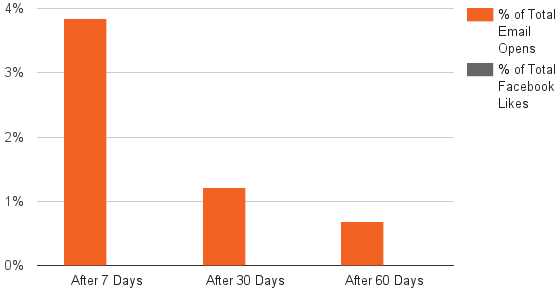
On the email side of this question we analyzed a dozen hotel and resort email campaigns sent to over 2,000,000 recipients during September of 2014. For Facebook we used 100 posts shared by ten pages with at least 100,000 fans each. Now a year in the rear view, we looked at what percentage of total opens (emails) or likes (facebook posts) occurred beyond 7 days, 30 days, and 60 days after the message was sent.

Of the emails in our sample, about 3.8% of unique opens came beyond 7 days after a campaign was sent, 1.2% beyond 30 days, and 0.8% beyond 60 days. For the Facebook posts, the average increase in likes beyond 7 , 30, and 60 days was so small (less than 0.01%), the resulting bars didn’t even show up on our graph.
What This Means
First, take a second to realize how long email’s tail of opens really is. The fact that 1% of unique opens happen more than two months after a campaign’s original send date is pretty incredible.
But also remember something that makes Facebook likes an imperfect comparison: the ability to “unlike” something. So, yes, there are probably likes that do happen beyond 7, 30, or 60 days, but realizing they appear to happen just as often as someone unlikes a post puts that frequency into perspective.