Trends

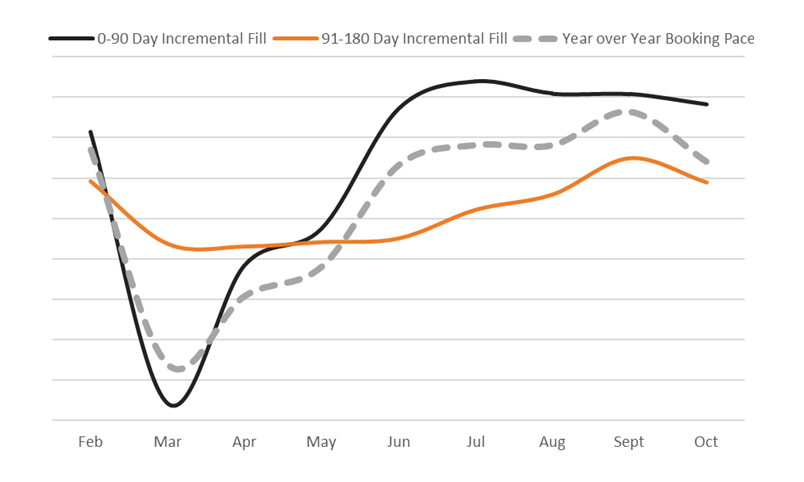
Booking Pace, the percent variance in the number of bookings for all arrival dates made over the past 30 days this year compared to the same for last year, trended downward into negative territory in October after steady performance since June and a bump in September (dotted line on chart above). Though it sounds bad, it’s not as bad as it might be, and is definitely what we’ve been projecting.
Incremental fill, the absolute volume of bookings in a month, for short-lead arrival dates within 0-90 days from booking (dark grey line) remains relatively consistent. Guests are booking a high volume of reservations for arrival in November, December, and the early part of January. In fact, these 2020 bookings are exceeding the same bookings made at this time last year, pushing booking pace up.
But incremental fill for arrival 91-180 days out (orange line) declined sharply from September and is not nearly as strong as the 0 to 90-day bookings. Under normal conditions last year, we saw a very strong volume booked in October 2019 for arrival 91-180 days out. The result is a dramatic booking pace decline for the longer-lead arrivals, forcing pace downward overall. The chart above conveys the relationship between the steady short-lead volume (grey), the declining long-lead volume (orange), and the booking pace decline (dotted).
If you would like more information on this or any of our products, please reach out via our contact form or get in touch with your destination analyst.
This post was written in 2020, to follow the latest booking pace trends from our destination intelligence team, visit the Inntopia BI Trends archives:
https://corp.inntopia.com/category/trends/