Trends

As the summer progresses, I want to explore some less mainstream ideas around product or marketing strategy that could be helpful in 2020/21.
Today, I think we should take a closer look at two charts that keep coming to mind over and over again.
I first shared these chart a few years ago, but the data and behaviors are deeply ingrained in humans and won’t change much, if at all, during a year like this.
Return Rate vs Streaks
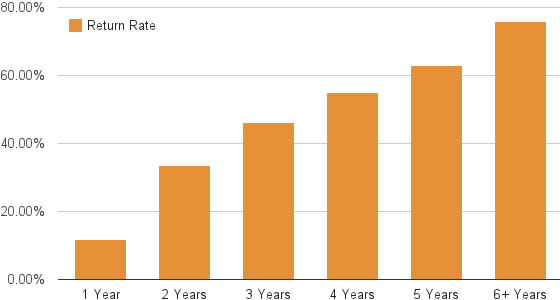
Let’s start with the lodging side. This chart represents how many guests showed up the following season based on how many years in a row they’d come leading up to that year (full write-up here).

In other words, streaks or annual traditions can make someone extremely likely to come back.
Passholders vs Renewal Rate
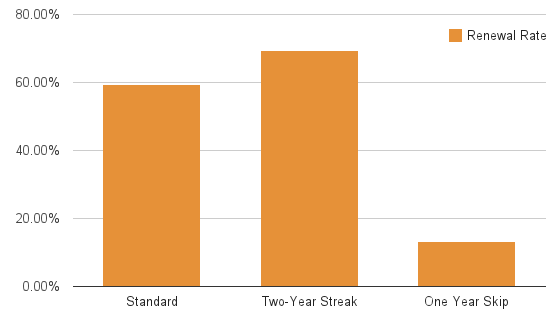
But what if they miss a year? For that side let me share an analysis I did of season passholders. In this case, we looked at the renewal rate of folks who had a pass last year but only last year (standard), those who had a two-year streak, and those who had a pass two years ago but not last year (full analysis here).

The moral of this story? Once they don’t renew, the likelihood of them coming back drops significantly. But if you can start a streak? The inverse is true. Renewal rates quickly jump.
Planning for Loyalty
This year could be very different. Some resorts have done away with season passes altogether. Lodging remains closed at many resorts.
Whether you have to go that far or only part way down that road, what I’m hoping to get you thinking about is these pockets of loyalty.
I’m not 100% sure what the right answer is to any of these questions, but I think the time is now to begin considering how you’ll answer them. And maybe, just maybe, increase that loyalty in a year when it could be very easy to lose it.