Trends
Has it already been a year since we last updated these stats? Hard to believe. But you know what they say, time flies when you’re helping resorts send hundreds of millions of crazy-effective, data-driven emails.
Before we jump into the results, some quick data behind the data:
We’ve broken these down by campaign type – “promotional” (one-time campaigns sent to larger groups), pre-arrival, and post-departure. Let’s jump right in.
Calculated by dividing unique opens by total campaign recipients.
We’ll start with open rate for each of these campaign types. Here’s what we’re seeing.
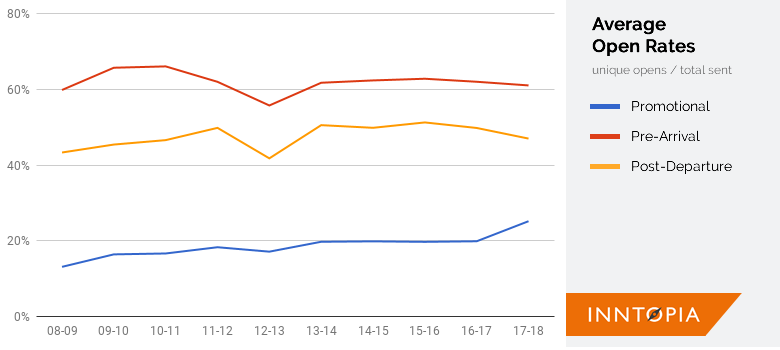
For pre-arrivals and post-departures, a slight dip but still in the 50-60% range on average and still on pace with the 5- and 10-year averages.
What really caught our eye, however, were promotional-style campaigns. Last year they sat just a whisker away from 20% at 19.9%. This year? A significant jump to 25.2%.
Calculated, based on past versions of this report, by dividing unique clicks by unique opens.
On the clicks side of things, the crazy percentages of a decade ago are in the rearview, but there are some solid signs.
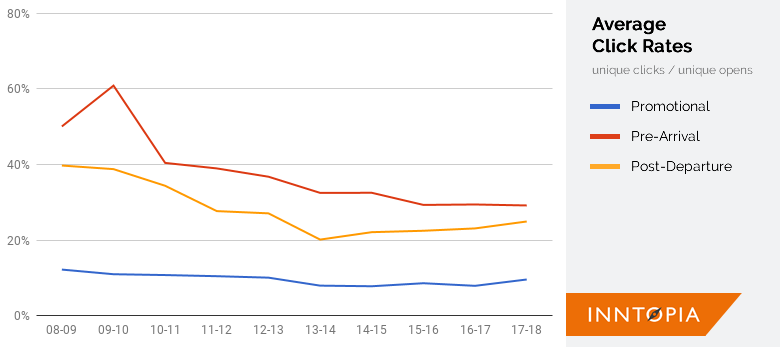
Pre-arrival click rates did drop about 1%, but both post-departure click rates were up 8% and promotional click rates were up 21%. Promotional click rates were actually the highest we’ve seen since 2012/13.
Calculated by dividing opt-outs by total campaign recipients.
So opens and clicks look pretty solid, but what about opt-outs? Every time I talk to someone they assume opt-outs will eventually skyrockets, but let’s take a look.
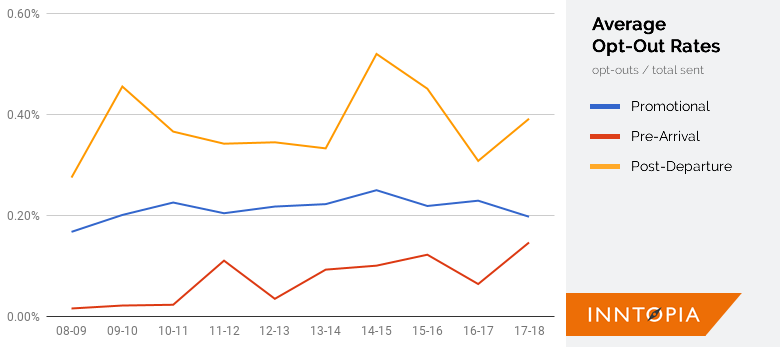
Pre-arrival opt-out rates are up but still well below the averages of any other campaign and post-departure rates are up YOY but even with the 5-year average. Once again, however, promotional emails saw a really strong trend. In fact, this season’s opt-out rate for promotional emails higher than only one other year; 2008/09, the first year we started aggregating these stats.
Is there any rain on this parade? Of course. As is the case every year, not everything is perfectly up and to the right.
But even when you look at the YOY dips, virtually nothing is below the 5-year average and there are plenty of indicators – especially related to promotional messages – that email is not just holding steady but surging as a marketing channel of choice as we near the mid-point of 2018.