Your own crystal ball: See how your online lodging performance stacks up to competitors
see historical comparisons and a 6-month forward-looking view
“How did you know?”
That’s the question your peers will be asking. Your rates will be adjusted perfectly to match demand, and your ad spends directed at exactly the right segments. They’ll wonder how you manage to understand how your property fits into the market so well. It’ll be up to you whether you tell them about CommerceMetrics.
What is CommerceMetrics?
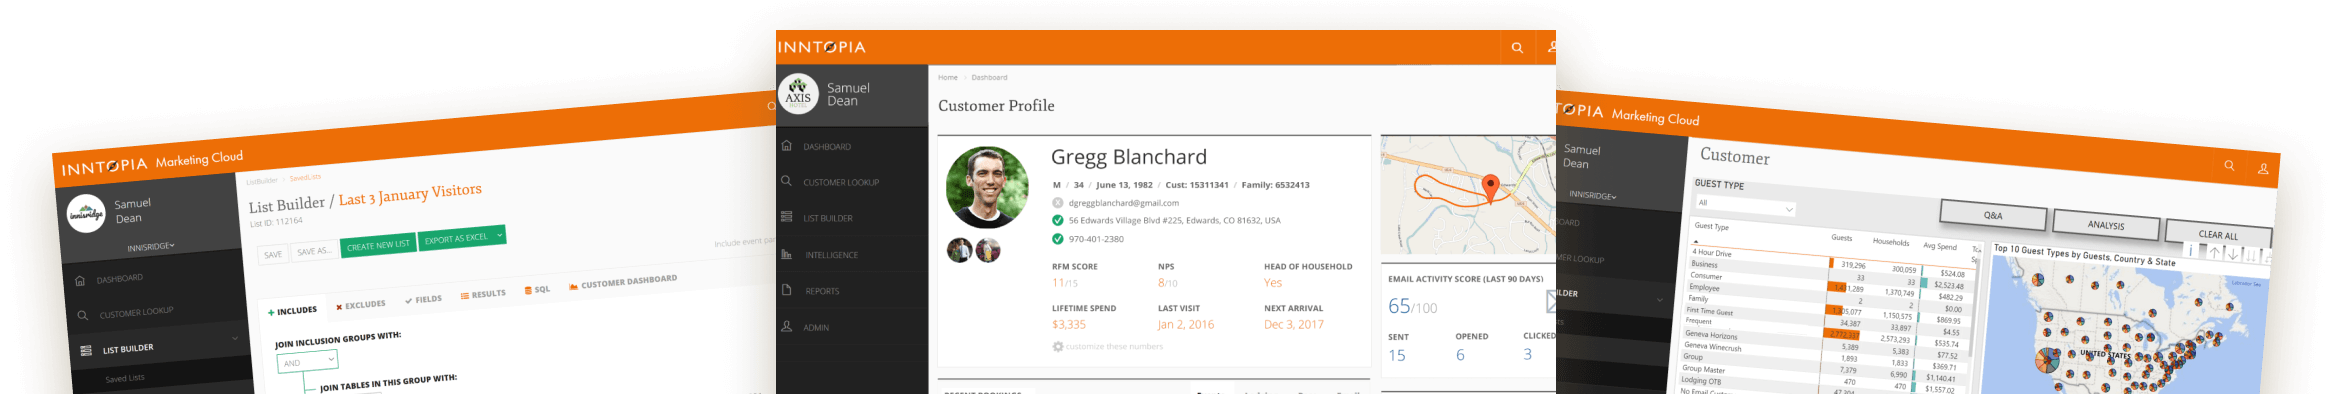
CommerceMetrics is a set of reports, graphs, and data that will completely change the way you understand how your occupancy, rate, RevPAR, and other metrics are doing compared to others in your destination, your region, and the industry.
The Process
CommerceMetrics is 100% automatic. There’s no set-up. We use property-level availability, rate and lodging transaction data collected and aggregated from Inntopia’s Commerce platform.
We then run this data through our proprietary, rigorous data standardization and analysis to provide you with a complete weekly report at a daily level of granularity.
Data is automatically collected from Inntopia transactions and event logs, so no submissions are required. If you’re currently making inventory available on the Commerce Network (what we call a Supplier), then you qualify to receive these game-changing reports.
The Results
CommerceMetrics gives you the key measures you need to evaluate your performance. We compare your historical trends to your competitors, and we give you a detailed look into how your and your competitors’ rate, occupancy, and revenue is tracking into the future.
What does all this mean?
Data-driven decisions that give you a competitive advantage.
The Report
Here are some of the key measures you’ll get with CommerceMetrics:
- Sold Occupancy Rate
- Average Daily Rate
- Revenue Per Available Room/Unit (RevPar)
- Booking Window
- Length of Stay
- Guest Region
Each week, your personalized report will be prepared by hand by our expert analysts. It will include:
A dashboard with everything at a glance – start here, and dig in.
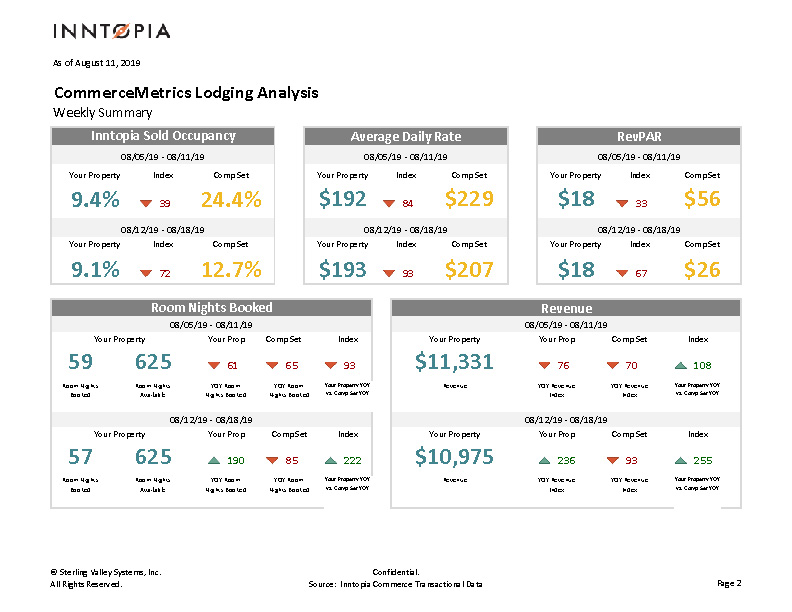
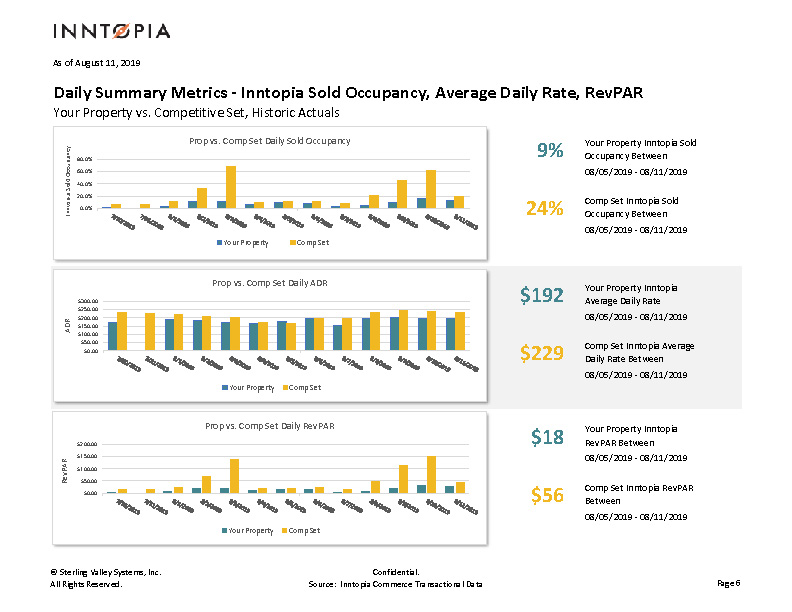
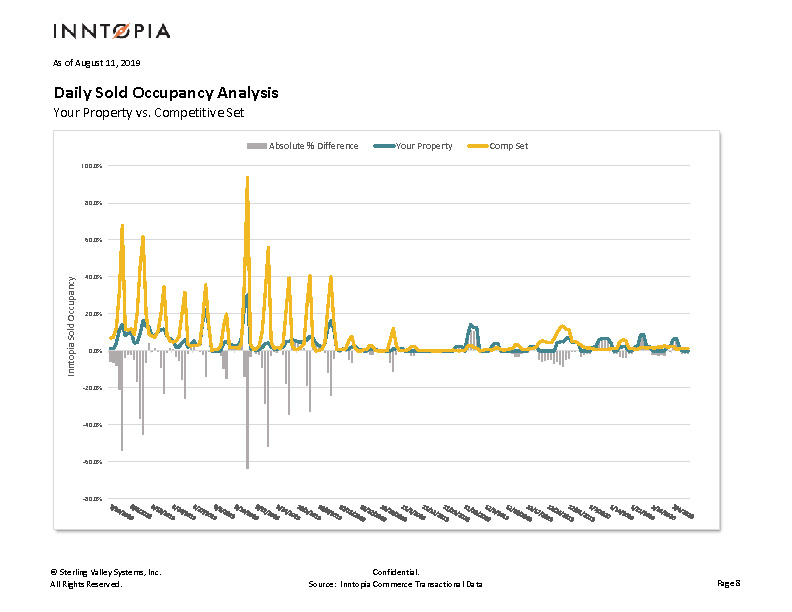
Your Property vs. Your Competitors – detailed reports that show how your occupancy, rate, and revenue is tracking vs. your geographic region.
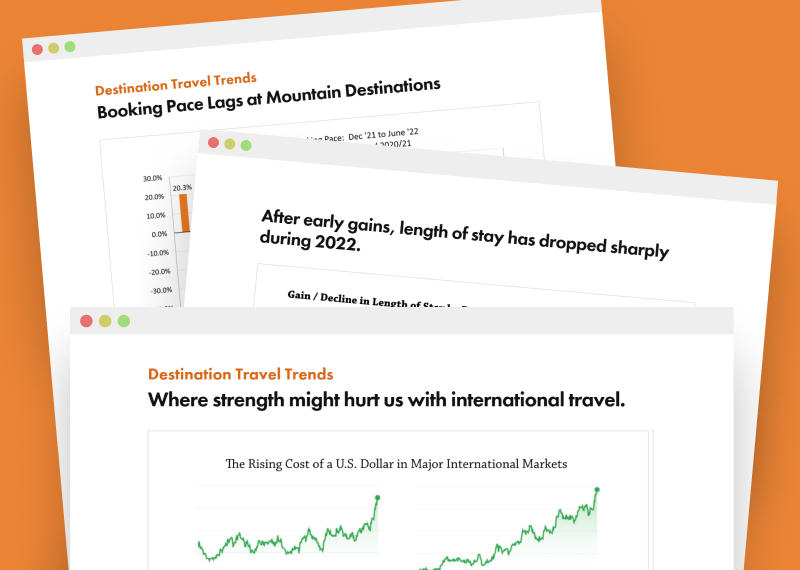
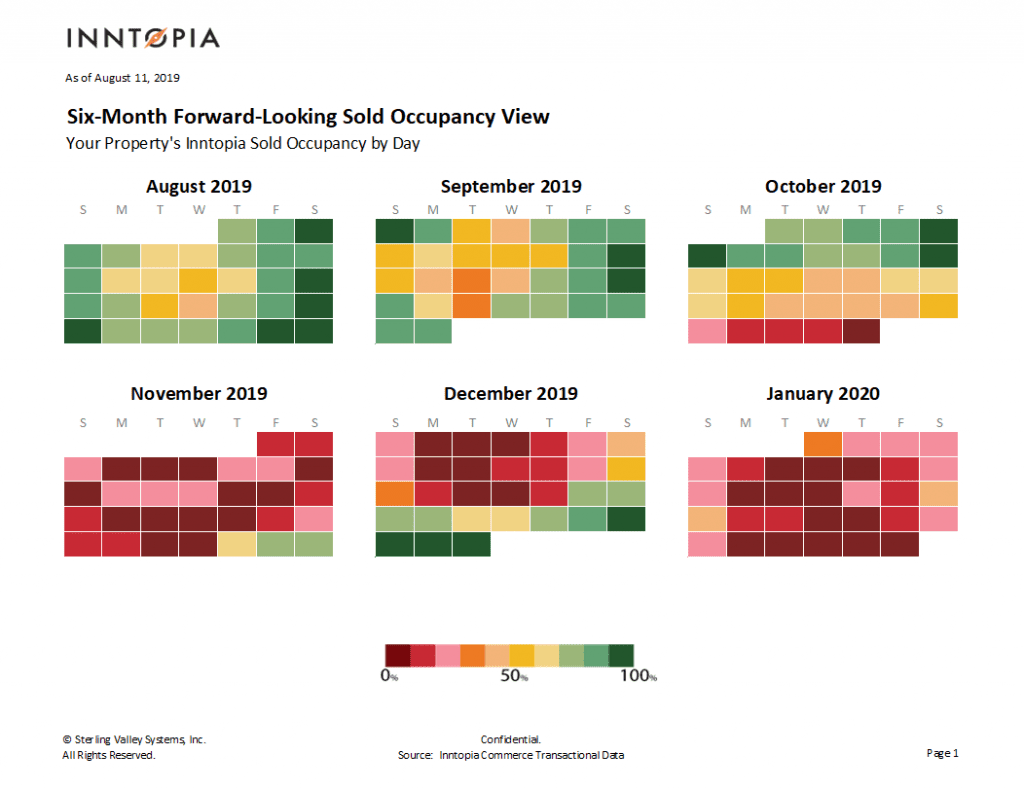
Forward-Looking Views – the “crystal ball” that tells you how your rates and occupancy look vs. your competitors for the next six months.
Where your guests are coming from – understand where your hot spots are, CommerceMetrics-Sample-Full-Report.pdfased on your own real reservation data.
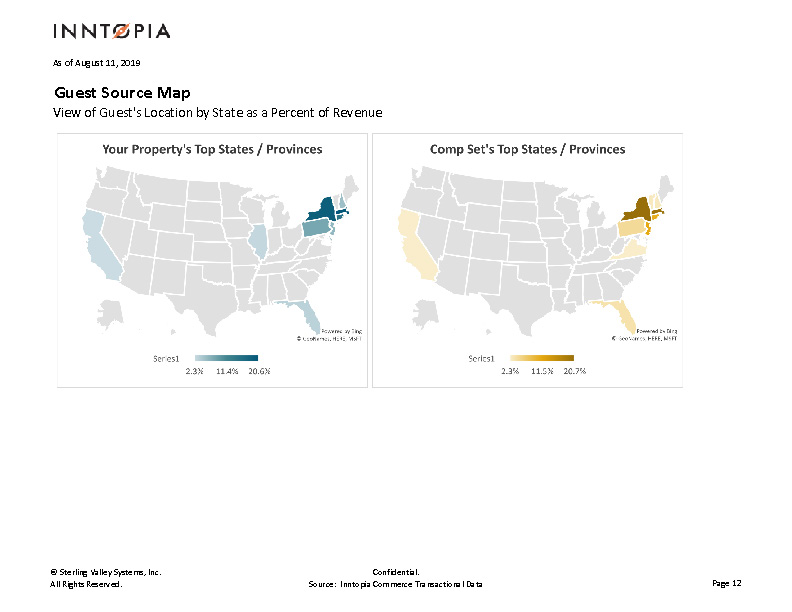
And much, much more.
→ Click here to take a look at a full sample report.
Pricing
Imagine the power of knowing exactly how your rates compare to other lodging providers in your area, both now and six months into the future.
If you knew that your occupancy was low and your rates were high compared to your competition months ahead of time, would you have time to do something about it and fill those rooms?
And this report delivers that.
CommerceMetrics, delivered weekly, created for you by our analysts with data automatically pulled from Inntopia Commerce, is just $199/month.
Sign Up Now
Reach out to your Account Manager, or simply fill out the form below to get started.